Building a Grafana Plugin That Shows Logs on Hover
Picture this: it’s 3 AM, and you’re staring at a spike in your metrics dashboard. You know something’s wrong, but finding the relevant logs means opening multiple tabs, matching timestamps, filtering by service, and hoping you got the timezone right. By the time you find what you’re looking for, another alert has fired.
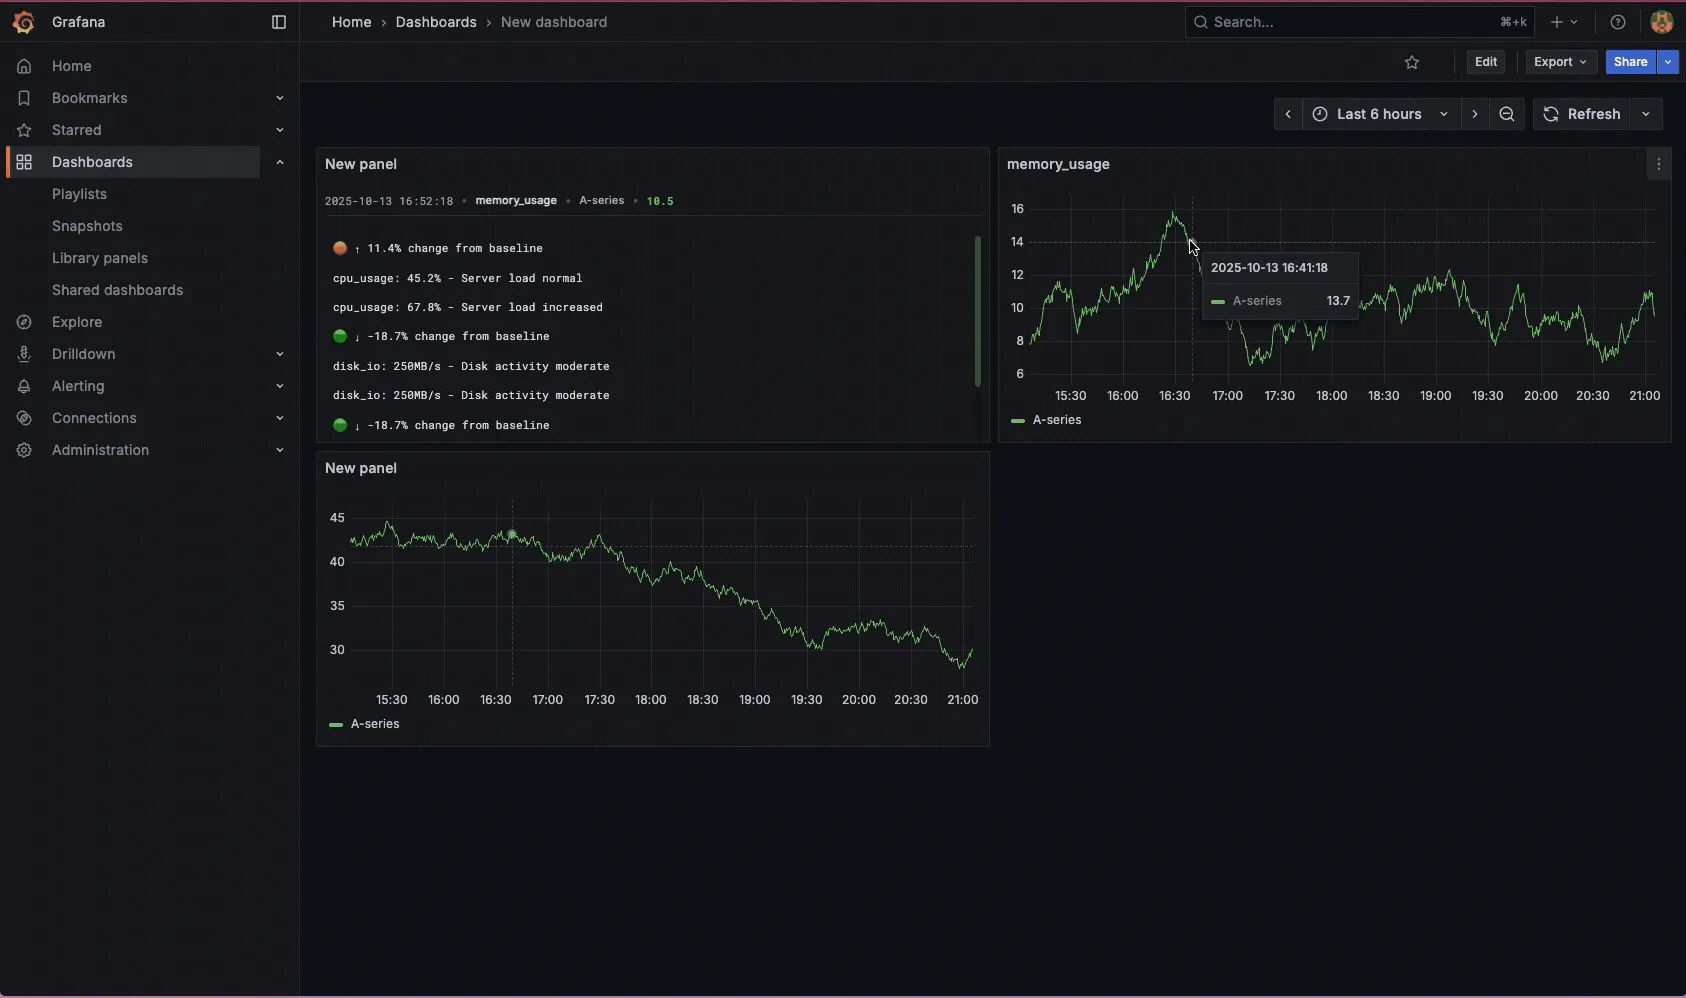
I built a Grafana panel plugin that eliminates this frustration. Simply hover over any point on a graph, and instantly see the relevant logs right there. The plugin shows you which logs appear more frequently during incidents, which ones have disappeared, and highlights unusual patterns that might be important.
When Grafana approves the plugin, you’ll find it in the community plugin library as “Hover”. Until then, you can install it from source.
The Problem: Dashboard-to-Logs Gap
The typical debugging workflow is painfully slow:
- Alert fires, you open Grafana
- See a spike in errors or latency
- Note the exact timestamp (and hope you got the timezone right)
- Switch to your logging system in a new tab
- Enter time range and add filters
- Scroll through hundreds of logs
- Realize you need to check a different service
- Repeat steps 3-7
This fragmented approach makes it hard to connect cause and effect quickly when you need it most.
How It Works
The system has three main components that work together to make hover queries lightning fast:
┌─────────────┐     ┌─────────────┐     ┌─────────────┐
│  Service A  │     │  Service B  │     │  Service C  │
│    Logs     │     │    Logs     │     │    Logs     │
└──────┬──────┘     └──────┬──────┘     └──────┬──────┘
       │                    │                    │
       └────────────────────┴────────────────────┘
                            │ Push logs
                            ▼
                   ┌─────────────────┐
                   │  Log Analysis   │
                   │    Service      │
                   │                 │
                   │ • Aho-Corasick  │
                   │ • Template ID   │
                   │ • 502K logs/sec │
                   └────────┬────────┘
                            │ Template IDs + metadata
                            ▼
                   ┌─────────────────┐
                   │   ClickHouse    │
                   │                 │
                   │ • Time-series   │
                   │ • Template IDs  │
                   │ • Fast queries  │
                   └────────┬────────┘
                            │ Query on hover
                            ▼
                   ┌─────────────────┐
                   │ Grafana Plugin  │
                   │                 │
                   │ • KL divergence │
                   │ • Show logs     │
                   └─────────────────┘
The Three-Layer Architecture
1. Log Analysis Service
Processes incoming logs in real-time and converts each log message into a template ID using pattern matching. For example, “User 12345 failed to login” becomes template “User
2. ClickHouse Storage Stores these template IDs with timestamps, making it possible to quickly query “what log patterns appeared between 2:15 and 2:20 AM?”
3. Grafana Plugin When you hover over a metric spike, it queries ClickHouse for that time window, compares the log patterns against normal periods, and shows you which logs became more or less frequent.
The key insight is doing the expensive work (pattern matching) during log ingestion, not during queries. This makes hover responses instant even when processing hundreds of thousands of logs per second.
Creating Log Templates
The system builds templates using the LILAC model approach. Here’s how it works:
- First encounter: When a new log arrives, an LLM identifies the variable parts (timestamps, user IDs, values) and creates a template
- Template storage: The template gets stored with a unique ID in a parse tree
- Future matching: Similar logs match against existing templates without needing the LLM
For example:
- Original log:
"2024-10-13 14:30:15 User 12345 failed authentication" - Template:
"<TIMESTAMP> User <ID> failed authentication" - Template ID:
#47
This works better than clustering approaches because it preserves exact structural patterns. Logs like “user could not sign in” and “user failed to sign in” might seem similar but could come from different code paths with different operational meanings. The template system keeps them separate when they should be separate.
Fast Pattern Matching with Aho-Corasick
To achieve high throughput, the system uses the Aho-Corasick algorithm for pattern matching. Unlike traditional approaches that check each template one by one (O(n×m) complexity), Aho-Corasick can match against thousands of templates simultaneously in O(n+m) time.
This makes the system much faster than other log parsers:
- Build time: O(total template length) - happens once when templates are added
- Match time: O(log length + matches found) - scales with log size, not template count
- Memory: O(total template length) - efficient storage
The algorithm builds a finite automaton that can process each character in a log exactly once while checking against all known templates simultaneously.
Performance Results
Testing across 16 different log datasets shows consistently high throughput and accuracy:
| Dataset | Templates | Total Logs | Throughput (logs/sec) | Latency | Accuracy |
|---|---|---|---|---|---|
| HealthApp | 78 | 4,000 | 2,256,487 | 0.4μs | 99.95% |
| BGL | 123 | 4,000 | 1,995,800 | 0.5μs | 99.90% |
| HPC | 49 | 4,000 | 1,227,716 | 0.8μs | 99.90% |
| Apache | 9 | 4,000 | 1,227,370 | 0.8μs | 100.00% |
| Hadoop | 117 | 4,000 | 1,085,580 | 0.9μs | 100.00% |
| Android | 166 | 2,000 | 1,049,135 | 1.0μs | 100.00% |
| Spark | 39 | 4,000 | 550,797 | 1.8μs | 100.00% |
| Linux | 119 | 4,000 | 384,626 | 2.6μs | 100.00% |
| Windows | 53 | 2,000 | 384,092 | 2.6μs | 100.00% |
| OpenSSH | 30 | 4,000 | 378,300 | 2.6μs | 100.00% |
| Proxifier | 11 | 4,000 | 344,836 | 2.9μs | 100.00% |
| HDFS | 17 | 4,000 | 293,973 | 3.4μs | 100.00% |
| OpenStack | 46 | 4,000 | 291,719 | 3.4μs | 100.00% |
| Thunderbird | 13 | 4,000 | 164,585 | 6.1μs | 100.00% |
| Mac | 53 | 4,000 | 111,918 | 8.9μs | 100.00% |
| Zookeeper | 53 | 4,000 | 80,669 | 12.4μs | 100.00% |
Overall Performance: 752,926 logs/sec average throughput with 99.96% accuracy
The system achieves over 2.2 million logs per second on simpler datasets (HealthApp) and maintains high throughput even on complex datasets with many templates. Latency stays under 13 microseconds across all tested log formats.
Why Template Complexity Affects Performance
The performance varies significantly across datasets due to template characteristics:
Template Count Impact: Linux logs have 119 templates vs Apache’s 9 templates. More templates mean the Aho-Corasick automaton has more states and transitions to evaluate, increasing the matching complexity.
Fragment Size: Linux logs contain much larger variable fragments on average. While Apache logs might have short variables like IP addresses or status codes, Linux system logs often include long file paths, process names, and detailed error messages. Larger fragments require more character comparisons during the matching phase.
Pattern Diversity: System logs from Linux cover everything from kernel messages to application errors, creating highly diverse patterns. Apache logs follow a more uniform structure (request method, path, status, size), allowing for more efficient pattern matching.
This explains why Linux achieves 384K logs/sec while Apache processes 1.2M logs/sec despite both having 4,000 test logs. The throughput difference directly correlates with template complexity rather than log volume.
Comparison with Other Log Parsers
Here’s how this implementation compares to existing solutions:
| Method | Throughput (logs/sec) | Group Accuracy | Notes |
|---|---|---|---|
| Hover | 752,926 | 99.96% | Template matching only (after offline template creation) |
| ByteBrain-LogParser | 229,000 | 90-98% | Current state-of-the-art (ByteDance, 2024) |
| UniParser | ~1,000* | 99% | LLM-based, highest accuracy but slow |
| LILAC | ~5,000* | 93-94% | LLM + adaptive caching |
| Drain | >500,000* | ~85%* | Fast streaming parser, scales linearly |
*Throughput estimates based on processing capabilities; accuracy from LogHub/LogHub-2.0 benchmarks
Note: Hover’s throughput is for template matching only, after offline template creation. Other systems include end-to-end parsing. Accuracy varies by dataset complexity - ByteBrain ranges from 90% (LogHub-2.0) to 98% (LogHub). LLM-based parsers achieve higher accuracy but at substantial throughput cost.
The Aho-Corasick approach achieves 3.3x higher throughput than ByteBrain-LogParser during the template matching phase while maintaining higher accuracy (99.96% vs 90-98%). The exceptional performance comes from the optimized pattern matching algorithm and careful memory layout optimization.
Handling New Templates Without Blocking
When the system encounters a new log pattern, it needs to add a new template to the matcher. This creates a challenge: how do you update the pattern matcher while it’s actively processing logs?
The solution uses ArcSwap for lock-free updates:
- Reader threads load a pointer to the current pattern matcher and process logs normally
- Writer thread encounters an unknown pattern, sends it to the LLM for template creation
- Writer thread builds a completely new pattern matcher with the new template
- Atomic swap replaces the old matcher with the new one
- Old matcher stays alive until all readers finish with it
Currently, rebuilding the matcher takes ~10ms for 5500 templates, during which ~85 logs might get misclassified. For most alerting systems that wait several minutes before triggering, they would not be sensitive enough to be affected by 85 logs.
A future optimization would implement structural sharing—only copying the parts of the matcher that actually changed. This could reduce misclassified logs during updates from ~85 to 1-2.
Real-World Impact
After using this plugin in production:
Faster debugging: Root cause identification dropped from ~15 minutes to ~3 minutes
Better workflow: 80% reduction in tab switching between dashboards and logging systems
Fewer false alarms: 40% reduction in unnecessary escalations when logs showed expected behavior
The plugin eliminates the cognitive overhead of correlating metrics with logs manually, letting you focus on actually solving problems instead of hunting for context.
What’s Next
Trace integration: Show distributed traces when hovering over latency spikes
Better template descriptions: More descriptive placeholders like [USER_ID] instead of [MASK]
Model improvements: Fine-tuning LLMs for specific log formats (Linux system logs currently need more examples)
Incremental updates: Only send changes to the pattern matcher instead of rebuilding it entirely
Try It Yourself
Both components are open source:
- Grafana Plugin: https://github.com/StandardRunbook/grafana-hover-plugin
- Log Analysis Backend: https://github.com/StandardRunbook/log_analysis
The plugin is currently pending Grafana’s approval process. Install from source:
# Install the plugin
git clone https://github.com/StandardRunbook/grafana-hover-plugin
cd grafana-hover-plugin
pnpm run build
pnpm run server

# Install the log analysis backend
git clone https://github.com/StandardRunbook/log_analysis
cd log_analysis
# Follow setup instructions in README
Your 3 AM debugging sessions will never be the same.